STEP 1: Seismic data acquistion
Seismic data is acquired on the field by conducting a seismic survey, in which seismic waves are generated by controlled active sources and propagated into the ground. When these waves encounter an interface between two different rock layers (i.e., an abrupt change of rock properties), part of their energy is reflected back to the surface, and recorded by a array of sensors. These recordings are referred to as seismograms and are similar to the ones measured by seismic stations that monitor earthquakes.
For land surveys (also called onshore acquistion), seismic signals are generated with vibroseis trucks or dynamite explosions, and are recorded by geophones, as shown in the animated schematic diagram below.
On the other hand, marine "offshore" seismic surveys use airgun sources deployed behind the seismic vessel, and an array of hydrophones (also towed behind the ship) record the water-pressure variations generated by the reflected energy.

The animation below shows the propagation of seismic waves generated by an airgun source, simulated on a computer with a finite-difference numerical scheme. The speed of sound (shown in the background) is one of the inputs used for the simulation. Cold/blue colors indicate a lower-velocity (1.5 km/s to 2.5 km/s), while warm/red colors correspond to velocity values ranging from 2.5 km/s to 4.5 km/s.
Disclaimer: the figure above (including the boat) is not drawn to scale! The vertical extent each panel is approximately 3.5 km in depth by 18 km in width.
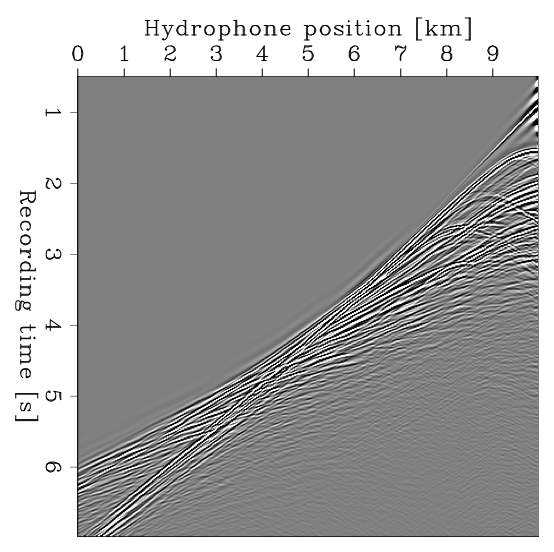
The figure below shows an example of offshore seismic data acquired with one source and a horizontal array of hydrophones, referred to as a common shot gather (one source, multiple sensors). The vertical axis corresponds to the recording time of the sensors, and the horizontal axis displays the hypdrophones' horizontal position (usually towed a few tens of meters underneath the surface). The black/white pixels corresond to the presence of pressure changes recorded by the geophones (arrival of a sound wave), and gray pixels indicate that no pressure change is observed.
In order to gather enough information about the subsurface, the procedure is performed tens of tousands of times. The goal is to "illuminate" or "interrogate" the subsurface from a wide range of positions and angles. Usually conducted by contracting companies, seismic surveys may last for months and cost tens of millions of dollars. Eventually, these datasets are stored numerically and may take up to tens of terabytes of memory.
Now that we understand more about how seismic data are acquired, let's learn about the next step of the seismic imaging process: velocity estimation.