Predicting brain tissue damage for stroke patients using Deep Learning and CTP data
Summary
- We use computed tomography perfusion (CTP) data combined with a supervised deep learning algorithm to predict voxelwise blood-flow properties within the brain for ischemic stroke patients
- We extract features from the density/time curves of each voxel with a supervised deep learning model based on convolutional layers
- We successfully apply our method on a dataset provided by the Stanford University School of Medicine and show its potential at recovering the main hemodynamic properties of the brain tissues
4-minute video summarizing our work
Key words for this project
- Artificial intelligence, machine learning, deep supervised learning
- Computer vision
- Healthcare
- Computed tomography perfusion (CTP) imaging
Ischemic strokes
Stroke is the leading cause of disability and the third leading cause of death in the United States (more information here). The most common type of strokes, referred to as ischemic strokes, are caused by a blockage in an artery that supplies blood to the brain. The blockage reduces the blood flow and oxygen to the brain, leading to irreversibly infarcted tissues (core) and severely ischemic, but potentially salvageable, tissues (penumbra). If circulation is not restored quickly, brain damage can be permanent. Consequently, there is a small time window (less than nine hours after the onset of the stroke) during which an accurate diagnostic must be made and therapy administered (Konstas et al. 2009).
CTP imaging
CTP is commonly used for imaging a wide range of diseases, such as stroke, brain tumors, epilepsy, infection, etc. In this project, we are mainly focused on the utility of CTP in stroke imaging, whereby CTP plays a critical role in the accurate diagnosis, treatment decision, and prognosis of acute stroke.
The data acquisition is conducted as follows. A small bolus of iodinated contrast is injected intravenously into the patient. As it travels through the cerebral circulation, the contrast modifies the brain tissue density, which can be monitored with CT scans acquired every few seconds and provide valuable information about capillary-level hemodynamics (i.e., how easily the blood flows through tissues) within the brain. Therefore, a CTP dataset can be seen as a 4D dataset because it consists in a collection of 3D CT scans acquired over time.
What do CTP data look like?
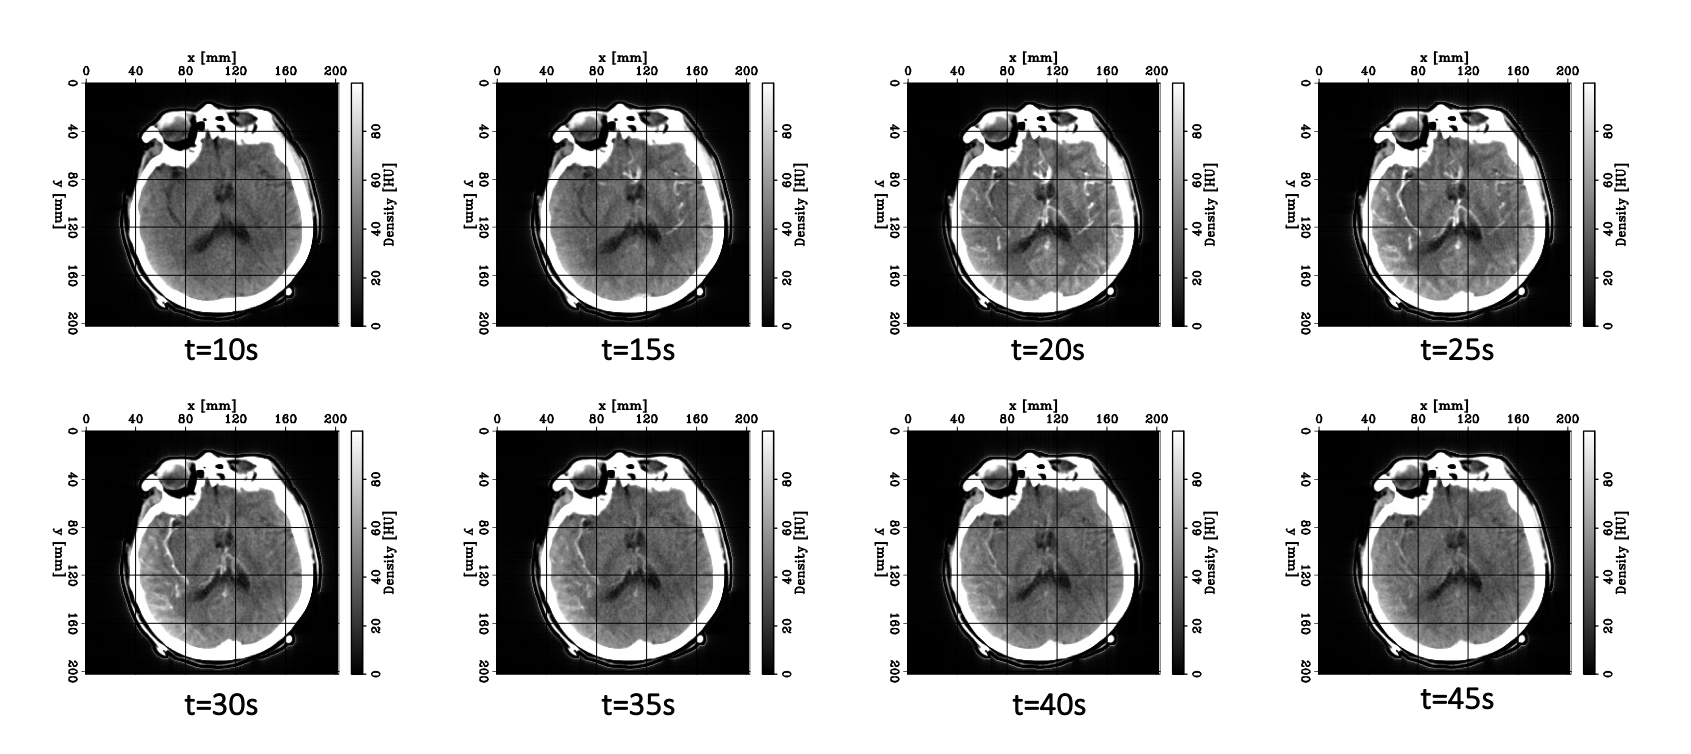
Let’s now take a look at real CTP data by examining the figure below. Each panel displays the same axial slice from a stroke patient extracted at different times during the acquisition process. Bright/dark colors indicate tissues with higher/lower density (measured in Hounsfield units), respectively.
- For t < 20 [s], the bolus has not reached the brain yet, and no clear density contrast can be observed within the brain tissues (the high-density halo surrounding the tissues corresponds to the patient’s skull).
- From 20 [s] < t < 45 [s], the bolus reaches the brain and perfuses the tissues (arterial phase), which can clearly be identified from the CT images.
- Additionally,from 30 [s] < t < 40 [s], we observe higher density values in the brain’s right hemisphere (left side of the image) compared to the left hemisphere. This could potentially indicate that the blood is having more difficulty flowing through this region, and thus the presence of damaged tissues.
- For t > 45 [s] (not shown here), the bolus is washed out of the brain (venous phase).
We now have a better intuition on why CTP data can be useful for detecting stroke lesions. If certain brain tissues are damaged, the blood vessels’ circulation will be reduced (or even blocked). Hence, our idea is to design a deep learning algorithm that will learn how to extract blood-flow information from these data and accurately characterize the damaged zones in the brain.
Motivation
Currently the raw CTP datasets are processed by commercial software packages to generate perfusion parametric 3D maps (CBV, CBF, TMAX). These maps are then interpreted by a radiologist to delineate (i.e., segment) the core from the penumbra. However, these packages are not standardized (thus making the results unreliable) and expensive (thus limiting CTP’s utility).
We propose to mitigate these issues by developing a robust supervised deep learning (DL) model, which we hope will have a profound impact on stroke imaging by (1) making the results more reliable and (2) by making the CTP technique more widely available and equitable.
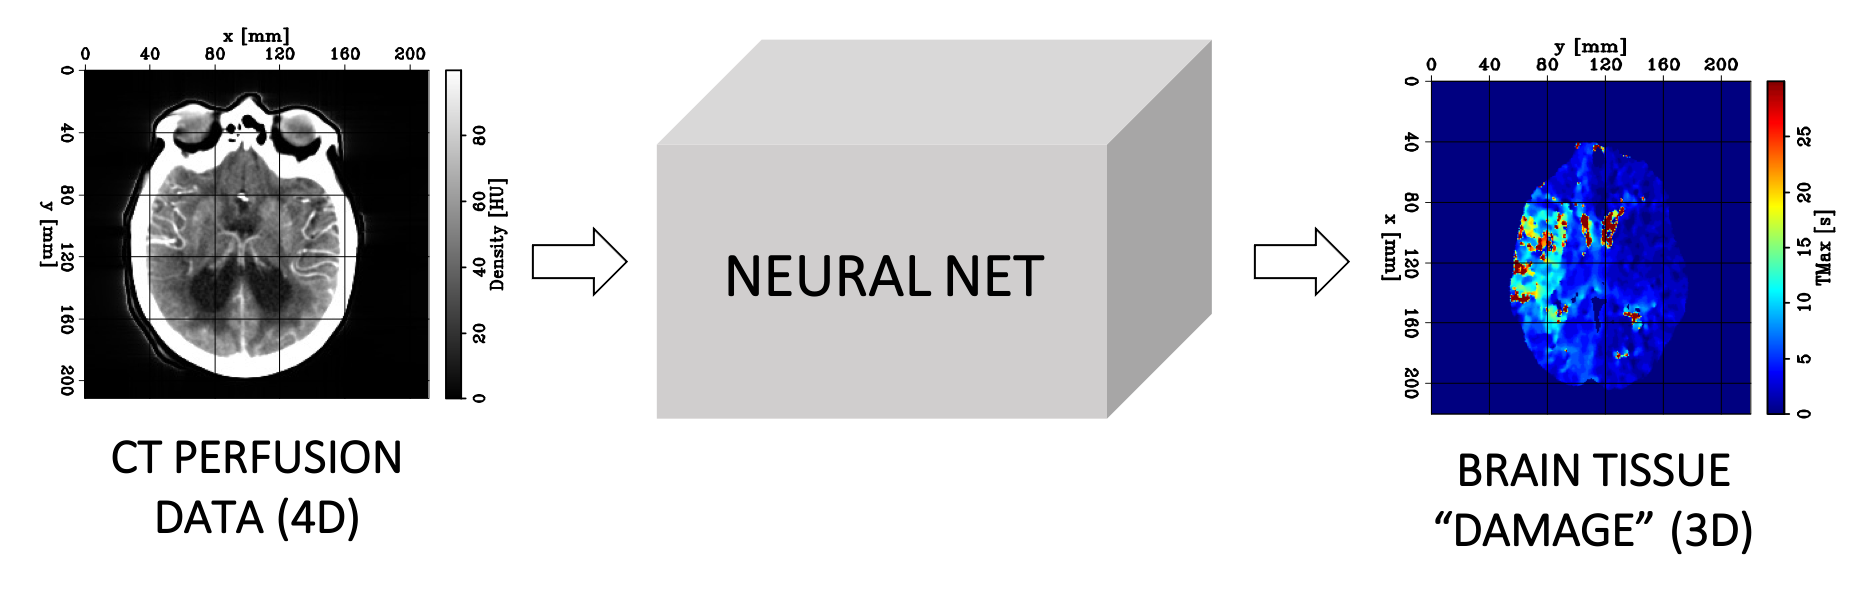
Our algorithm uses 4D CTP data as input and predicts a 3D image corresponding to the value of a hemodynamic parameter referred to as TMAX at every position (voxel) of the brain. This parameter represents the delayed arrival of the contrast bolus and guides the radiologist to accurately predict and delineate the extent of the core and penumbra. Higher TMAX values may indicate the presence of damaged tissues.
Our approach
While many authors have successfully applied DL methods on 3D CT data for image segmentation or classification (Barros et al. 2020; Park et al. 2019), our task here is of different nature because most of the useful hemodynamics information for predicting TMAX is carried by the time axis of the data.
In the first phase of our project, we choose to tackle this regression problem by casting it as a 1D time-series analysis (Kiranyaz et al. 2021). Similarly to the main software packages, we process the density curves (i.e., the variation of the density value at a given voxel as a function of time) of each voxel independently.
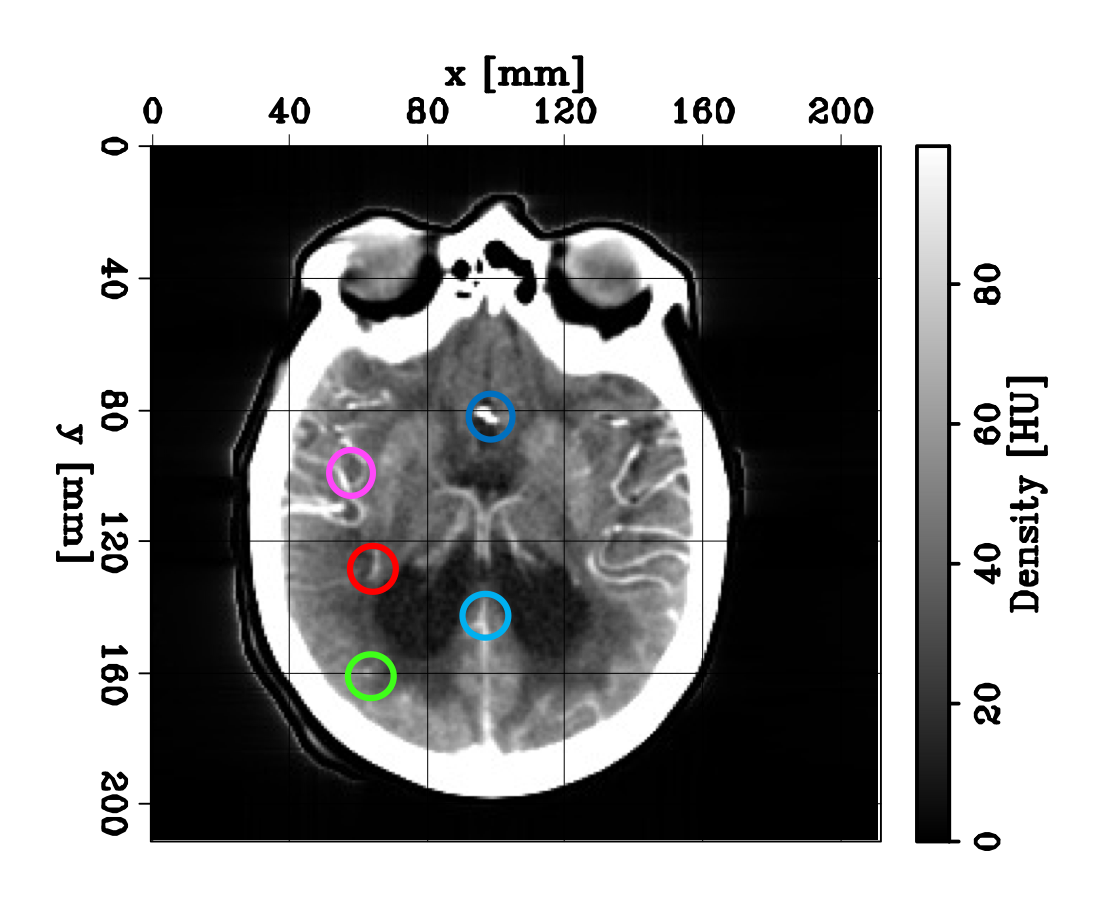
We show an example of such density curves in the figures below. The left panel shows an axial slice during a CTP acquisition. The colored circles indicate the extraction location of the different curves shown in the right panel. The dark blue curve is referred to as the arterial input function (AIF). It shows the density variation observed at a voxel located in the region first reached by the bolus, close to the middle cerebral artery (MCA).
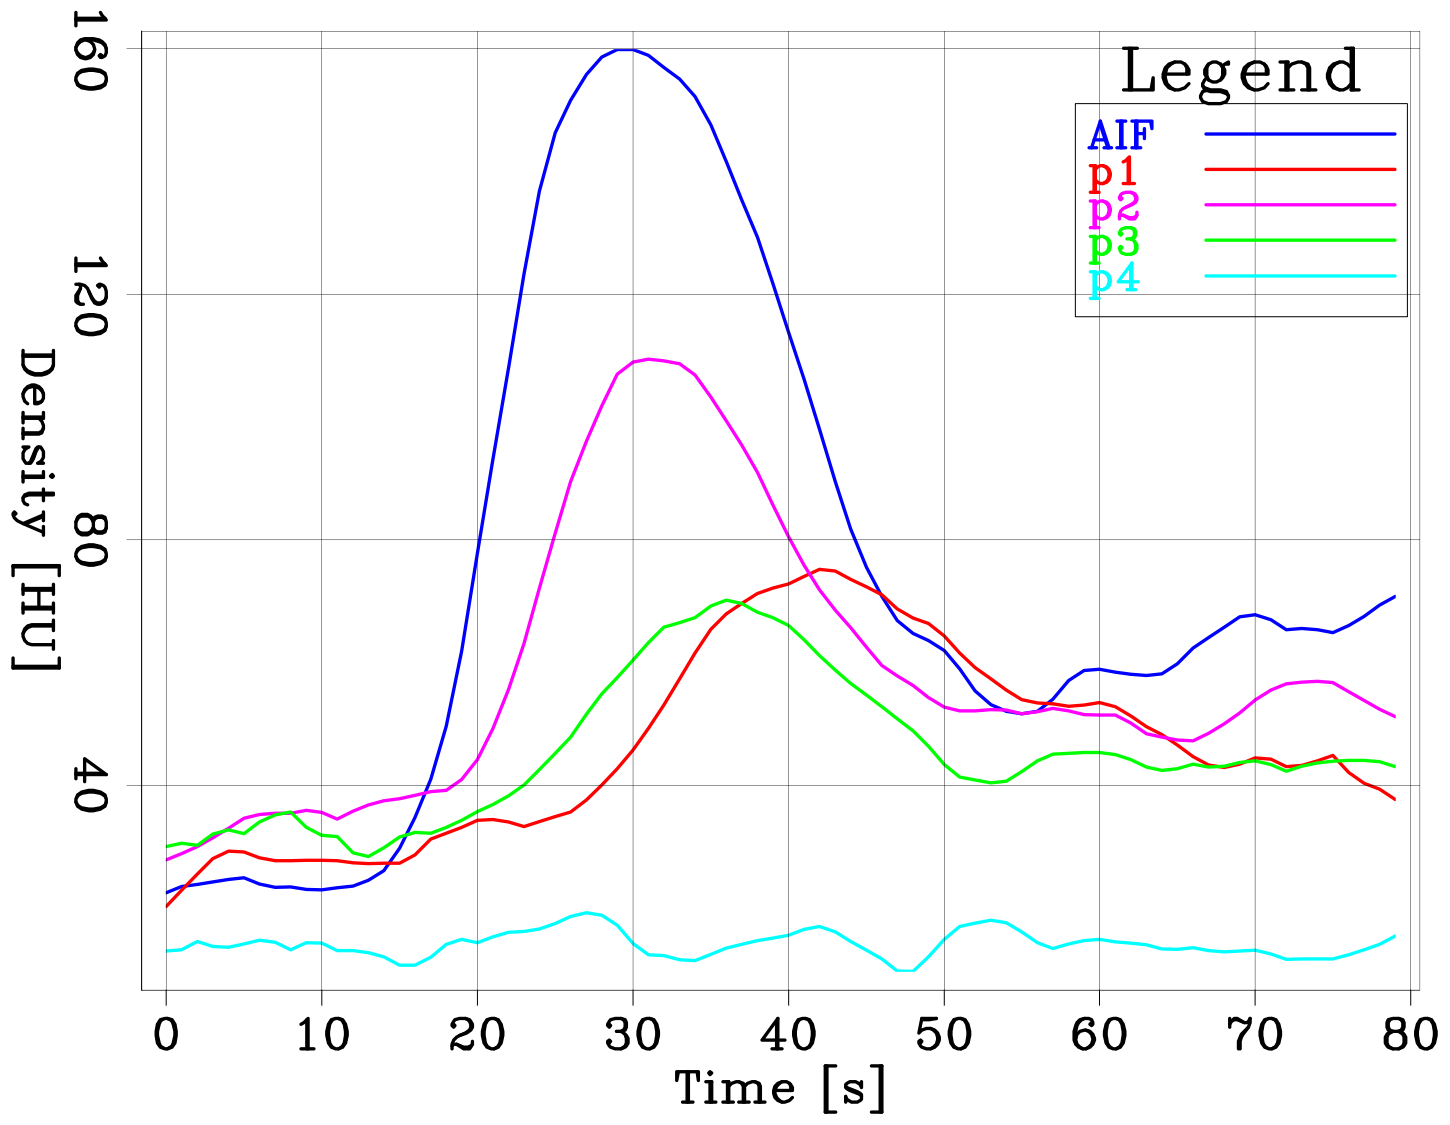
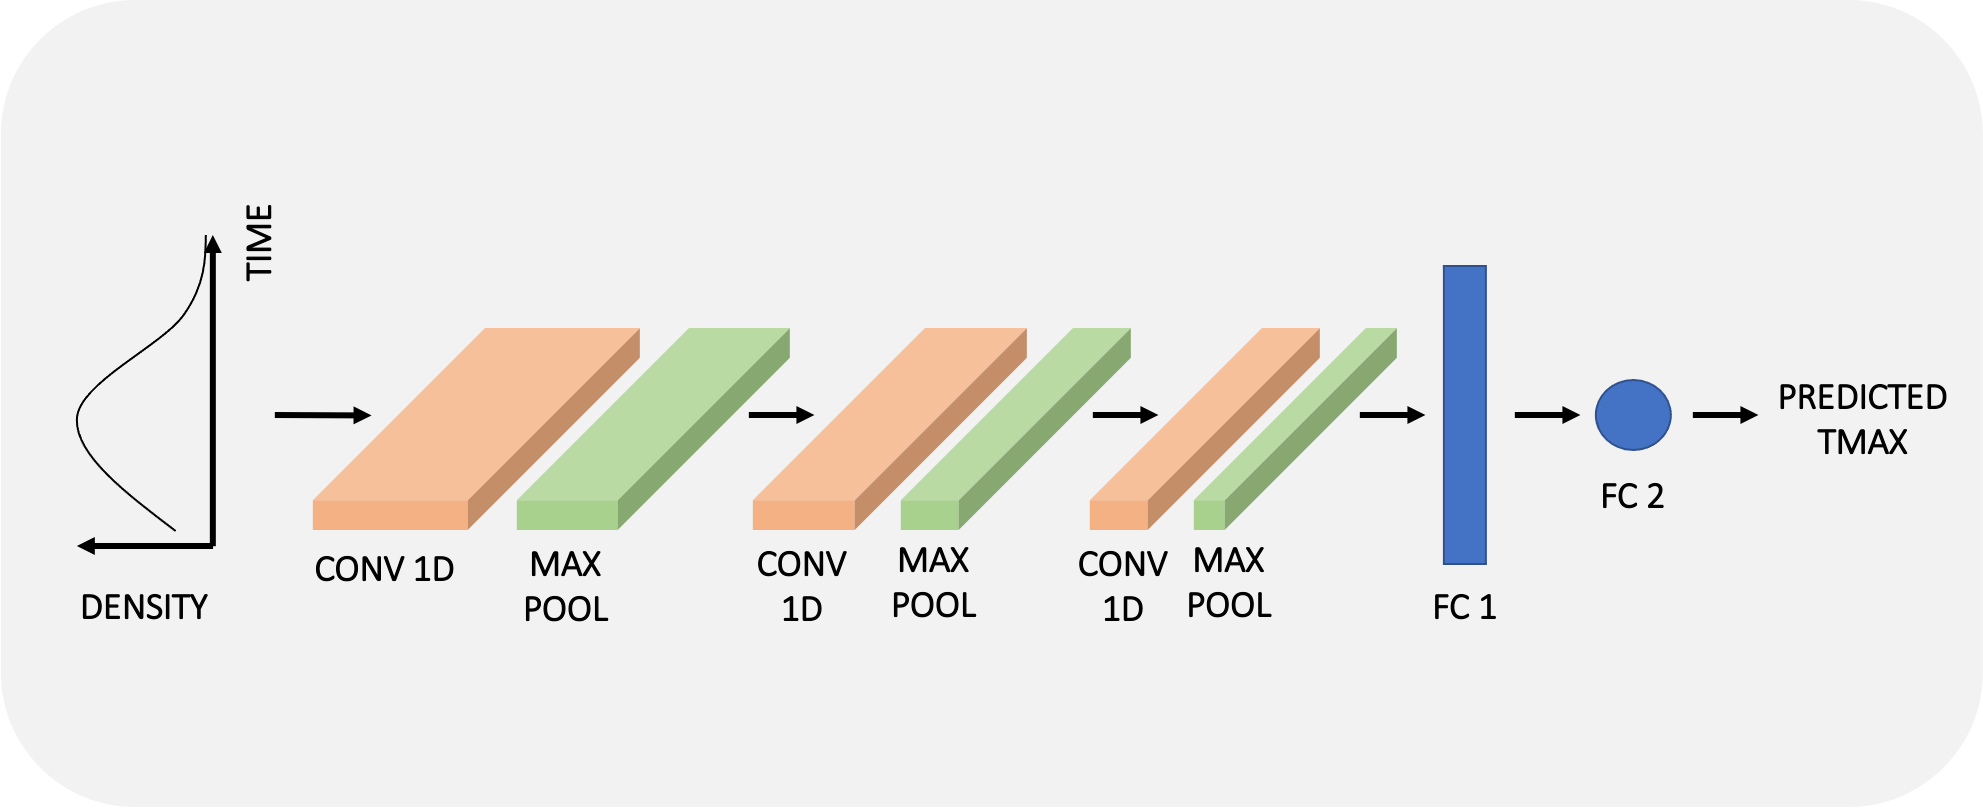
Following our “1D approach”, one training example will thus consists of one density curve of 80 time steps (our data) with its labelled TMAX value computed by an available software (and assumed as ground truth for now). We extract features from the time signals by using an architecture composed of 1D convolutional layers, pooling layers, and fully connected layers as shown in the schematic diagram below. For more details on our architecture (and choice of hyperparameters), check out our code repository.
Pre-procssing steps
We found the pre-processing steps for CTP data to be very challenging. The additional difficulty compared to 2D or 3D CT datasets stems from the time component. As these are inherently longer scans, motion in both spatial and time domains are very challenging to correct. A slightly suboptimal co-registration can deteriorate the density/time curves for a given voxel, which would greatly affect any algorithm’s performance. Again, you can find the detailed steps in our report and the code on our repository.
Our results so far
We show the efficacy of our method on a CTP dataset provided by the Stanford University School of Medicine, comprised of approximately 400 anonymous stroke patients.
The panels below show four axial (depth) sections of TMAX maps computed by one of the available software packages (bottom row) and our prediction on one of the patients from the test set (top row). After training on approximately 2.5M examples (~8 patients), we managed to recover the low-wavenumber components (the trends) of the software output. Even though the results suffer from noise due to the lack of spatial information fed to the network, the main features have been captured by “learning” solely from the time axis of the CTP dataset.

Next steps
In this first phase of our project, we showed that the main source of information contained in the CTP dataset could be encoded and extracted just from the time axis. We developed a computationally and data-efficient solution that allows to recover the main trends of TMAX maps. We purposely chose to neglect the spatial relationship between adjacent voxels as a “first order” solution but we believe these results can be greatly improved by adding a spatial encoding sequence into our workflow, and we are currently working on such implementation. Additionally, we also want test our algorithm’s ability to perform well when the number of scans is reduced during the acquisition process, thereby limiting the patient’s exposure to radiations.
Numerical implementation
Our numerical optimization code is implemented using the PyTorch open source machine learning library based on the Torch library, and is accessible on our project Github repository. Our training process was conducted on four V100 Tesla GPU cards.
The team
Links
Check out our project repository, download our report and watch the 4-minute video summarizing our work.
Other useful links
- A pratical Introduction to CT by Rajesh Bayana
- Introduction to CT Head: Approach and Principles by Rajesh Bayana
- What is a stroke by Khan Academy
- Ischemic stroke by Khan Academy
References
- Barros, R. S., Tolhuisen, M. L., Boers, A. M., Jansen, I., Ponomareva, E., Dippel, D. W., van derLugt, A., van Oostenbrugge, R. J., van Zwam, W. H., Berkhemer, O. A., et al., 2020, Automatic segmentation of cerebral infarcts in follow-up computed tomography images with convolutional neural networks: Journal of neurointerventional surgery,12, no. 9, 848–852
- Kiranyaz, S., Avci, O., Abdeljaber, O., Ince, T., Gabbouj, M., and Inman, D. J., 2021, 1d convo-lutional neural networks and applications: A survey: Mechanical Systems and Signal Processing,151, 107398
- Konstas, A., Goldmakher, G., Lee, T.-Y., and Lev, M., 2009, Theoretic basis and technical implementations of ct perfusion in acute ischemic stroke, part 1: theoretic basis: American Journal of Neuroradiology, 30, no. 4, 662–668
- Park, A., Chute, C., Rajpurkar, P., Lou, J., Ball, R. L., Shpanskaya, K., Jabarkheel, R., Kim, L. H.,McKenna, E., Tseng, J., et al., 2019, Deep learning–assisted diagnosis of cerebral aneurysmsusing the headxnet model: JAMA network open,2, no. 6, e195600–e195600.
- Ukmar, M., Degrassi, F., Pozzi Mucelli, R. A., Neri, F., Mucelli, F. P., and Cova, M. A., 2017, Perfusion ct in acute stroke: effectiveness of automatically-generated colour maps: The British journal of radiology, 90, no. 1072, 20150472.
Acknowledgements
We thank our principal investigator Dr. Elizabeth Tong for her amazing guidance, knowledge, expertise, and positive energy. We also thank Pranav Rajpurkar, Eric Loreaux, Ashwin Agrawal, Fantine Huot, Bob Clapp, and Stuart Farris for their help and advice.